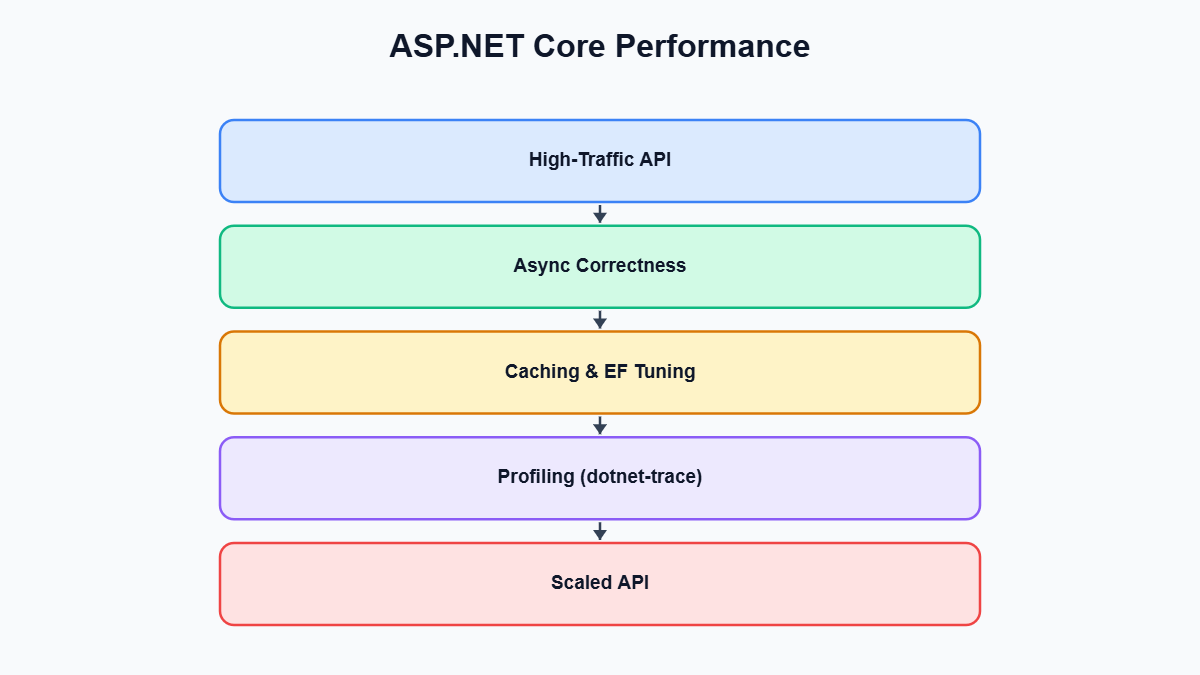
A .NET API can work perfectly in staging and still fall over under real production load. When that happens, the root cause is almost never a single catastrophic bug. It’s usually a collection of small inefficiencies: a blocking call here, an untracked entity graph there, a misconfigured middleware pipeline. These problems only become visible once concurrent request volume climbs into the thousands per minute. ASP.NET Core Performance Tuning is the practice of finding and removing those inefficiencies systematically, instead of reacting to outages after they happen.
This post walks through the areas that matter most for high-traffic APIs: async correctness, caching, data access, serialization, middleware ordering, scaling, and the diagnostic tools that tell you where to actually spend your time. If you are scoping this kind of work for a team, it is also the kind of specialized effort where bringing in an experienced ASP.NET Core developer for a focused engagement can pay for itself many times over in avoided downtime.
Key Takeaways
- Most production slowdowns come from a stack of small inefficiencies, not one big bug — sync-over-async calls, N+1 queries, and misconfigured middleware are the usual suspects.
- Await all the way up the call stack, and thread a
CancellationTokenthrough to data access and downstream calls. - Cache deliberately: output caching for full responses,
IMemoryCacheor Redis for computed values, and tag-based invalidation so you are not flushing everything on every update. - Database access is usually the biggest win. Use
AsNoTracking()for read-only queries, project into DTOs, and eagerly load related data to avoid N+1 queries. - Profile before you optimize. Use dotnet-trace, an APM tool, and BenchmarkDotNet to find the real bottleneck instead of guessing.
Async/Await Done Correctly
The single most common performance killer in production ASP.NET Core applications is sync-over-async code — calling .Result or .Wait() on a task instead of awaiting it. This pattern blocks a thread pool thread while it waits for an I/O-bound operation to complete, and under load it triggers thread pool starvation: the pool has to grow slowly, new requests queue up waiting for a free thread, and latency spikes across the entire application even though CPU utilization looks low. The fix is straightforward in principle — await all the way up the call stack — but it requires discipline across an entire codebase, including in places developers do not expect, like static constructors, custom middleware, and background service loops.
A properly written async controller action should never block on I/O. Every database call, HTTP client call, or file operation should be awaited, and the method signature should return a Task or Task<T> all the way through.
[ApiController]
[Route("api/orders")]
public class OrdersController : ControllerBase
{
    private readonly IOrderRepository _orders;

    public OrdersController(IOrderRepository orders)
    {
        _orders = orders;
    }

    [HttpGet("{id:int}")]
    public async Task<ActionResult<OrderDto>> GetOrder(int id, CancellationToken cancellationToken)
    {
        var order = await _orders.GetByIdAsync(id, cancellationToken);
        if (order is null)
        {
            return NotFound();
        }

        return Ok(order.ToDto());
    }
}
Note the CancellationToken parameter, which ASP.NET Core automatically wires up to the request’s abort signal. Threading it through to your data access and downstream HTTP calls means that when a client disconnects or a request times out, work stops immediately instead of continuing to consume thread pool and database resources for a response nobody will receive. It is a small addition that compounds into meaningful capacity headroom once you are running thousands of concurrent requests. Also watch for async void methods outside of event handlers — exceptions thrown inside them cannot be caught by the caller and will crash the process, which is a particularly nasty failure mode to debug under load.
Response Caching and Output Caching Strategies
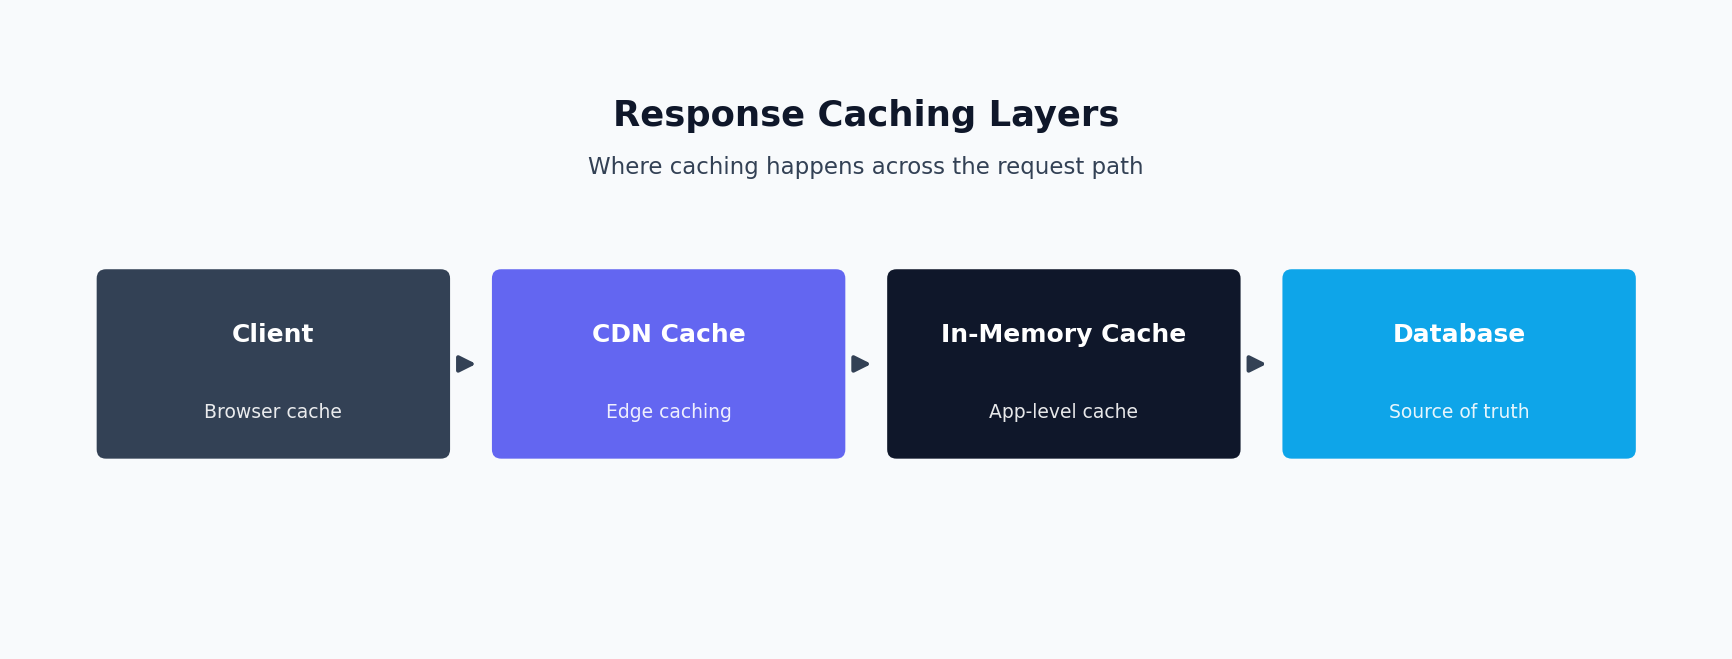
Not every request needs to hit your application logic and database. For endpoints that return the same data to many callers within a short window — product catalogs, configuration data, public content — output caching can eliminate the majority of backend work entirely. ASP.NET Core’s built-in output caching middleware caches the full HTTP response and serves it directly for subsequent matching requests, which is far cheaper than re-executing controller logic and re-serializing a response every time.
var builder = WebApplication.CreateBuilder(args);
builder.Services.AddOutputCache(options =>
{
    options.AddPolicy("Catalog", policy =>
        policy.Expire(TimeSpan.FromSeconds(60))
              .Tag("catalog"));
});

var app = builder.Build();
app.UseOutputCache();

app.MapGet("/api/products", async (ICatalogService catalog) =>
{
    var products = await catalog.GetAllAsync();
    return Results.Ok(products);
})
.CacheOutput("Catalog");

app.Run();
The tag-based invalidation shown above is important: when a product is updated, you can evict just the catalog tag rather than flushing the entire cache or waiting out a fixed expiry, which keeps data reasonably fresh without sacrificing hit rate. For scenarios where output caching is too coarse — you need to cache a computed value inside a service rather than a full HTTP response — IMemoryCache or a distributed cache like Redis is more appropriate, and it is worth being deliberate about which layer owns the cache so you do not end up with the same data cached redundantly at multiple levels with inconsistent expiry.
Response caching headers (Cache-Control, ETag) are also worth setting correctly even when you are not using server-side output caching, because they let browsers, mobile clients, and CDNs avoid the round trip altogether. For high-traffic public APIs, pushing caching as close to the client as possible is almost always more effective than any amount of server-side tuning.
Minimal APIs vs Controllers: Overhead Considerations
Minimal APIs were introduced to reduce the ceremony and per-request overhead associated with the traditional MVC controller pipeline. Controllers go through model binding, filter execution, and action invocation machinery that, while flexible, does carry measurable overhead compared to a minimal API endpoint that maps a route directly to a delegate. For high-throughput, latency-sensitive endpoints — a hot health check, a simple lookup endpoint hit millions of times a day — minimal APIs are worth considering specifically because they trim that overhead.
That said, the difference matters far less than people assume for typical business endpoints where a database call or downstream HTTP request dominates the total request time. Rewriting an entire mature controller-based API to minimal APIs purely for a marginal per-request overhead reduction is rarely a good use of engineering time. A more pragmatic approach is to keep controllers where they provide value — model binding validation, consistent filter pipelines, Swagger integration, shared base classes — and use minimal APIs selectively for genuinely hot paths or new lightweight services where the reduced ceremony is a net win for both performance and simplicity. The architectural decision should be driven by actual measured bottlenecks, not by a general belief that one style is always faster.
Connection Pooling and Database Query Optimization
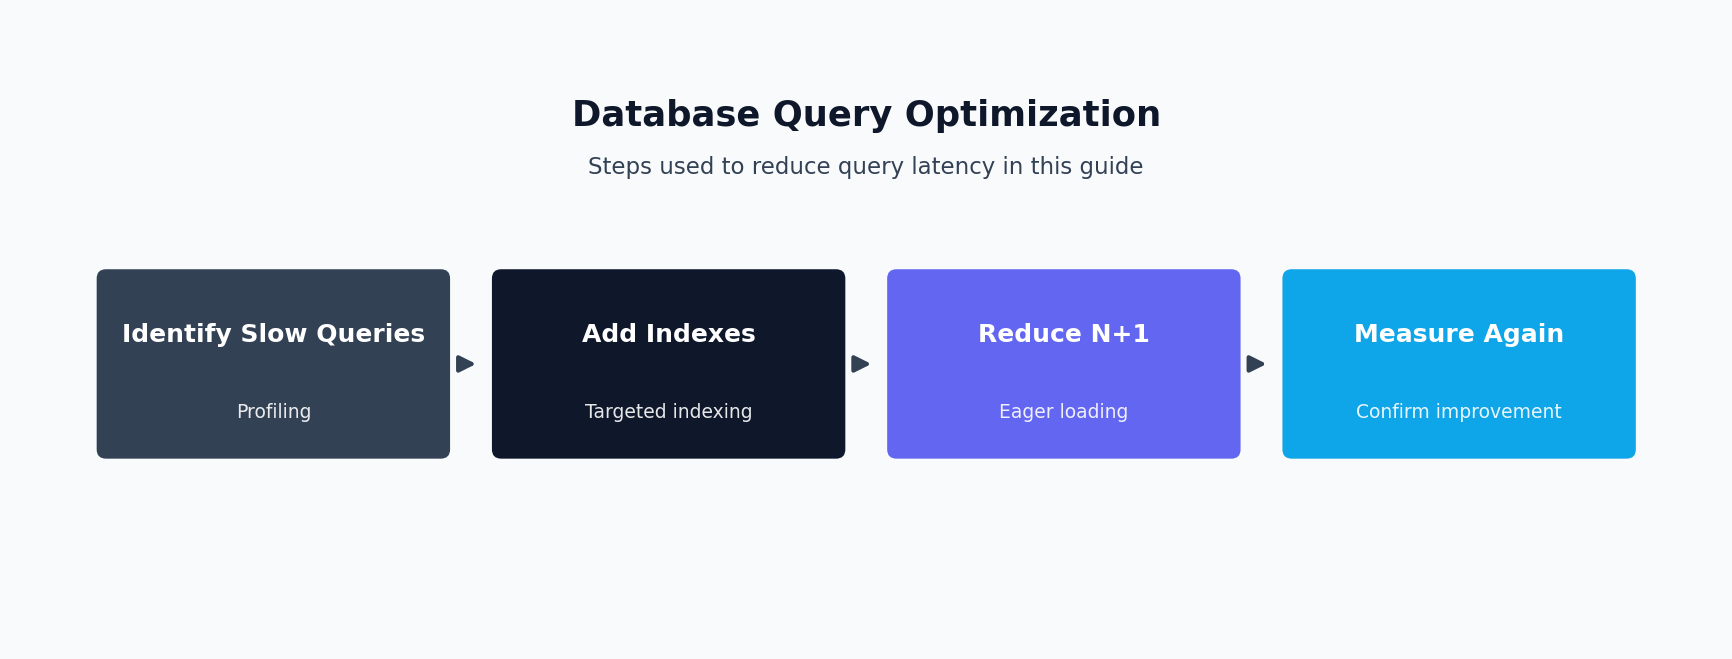
Database access is where most high-traffic ASP.NET Core APIs actually spend their time, and it is where ASP.NET Core Performance Tuning efforts tend to yield the biggest wins. Two problems show up again and again: unnecessary change tracking on read-only queries, and the N+1 query pattern where a single logical request quietly issues dozens or hundreds of round trips to the database.
Entity Framework Core tracks entities by default so it can detect and persist changes back to the database. For read-only queries — the majority of traffic on most APIs — that tracking overhead is pure waste. Calling AsNoTracking() tells EF Core to skip building the change-tracking snapshot, which reduces both CPU and memory overhead, especially for queries returning larger result sets.
public async Task<List<OrderSummaryDto>> GetRecentOrdersAsync(
    int customerId, CancellationToken cancellationToken)
{
    return await _dbContext.Orders
        .AsNoTracking()
        .Where(o => o.CustomerId == customerId)
        .OrderByDescending(o => o.CreatedAt)
        .Take(20)
        .Select(o => new OrderSummaryDto
        {
            Id = o.Id,
            Total = o.Total,
            Status = o.Status
        })
        .ToListAsync(cancellationToken);
}
Projecting directly into a DTO with Select(), as shown above, has an additional benefit beyond avoiding tracking overhead: EF Core can translate the projection into a SQL query that only selects the columns you actually need, rather than pulling back entire entity rows. For wide tables this can meaningfully reduce both database load and the amount of data transferred over the wire.
The N+1 problem is subtler and often invisible in local testing with small datasets. It happens when code loads a collection of parent entities and then, for each one, lazily triggers a separate query to load related child data — for example, iterating over a list of orders and accessing order.Customer.Name for each one without having eagerly loaded the customer. What looks like one query in the code becomes one-plus-N queries against the database, and at high concurrency this can multiply database connection pressure dramatically. The fix is to use Include() to eagerly load related data in a single query, or better yet, to project only the specific fields you need so EF Core can generate one efficient joined query instead of loading entire object graphs.
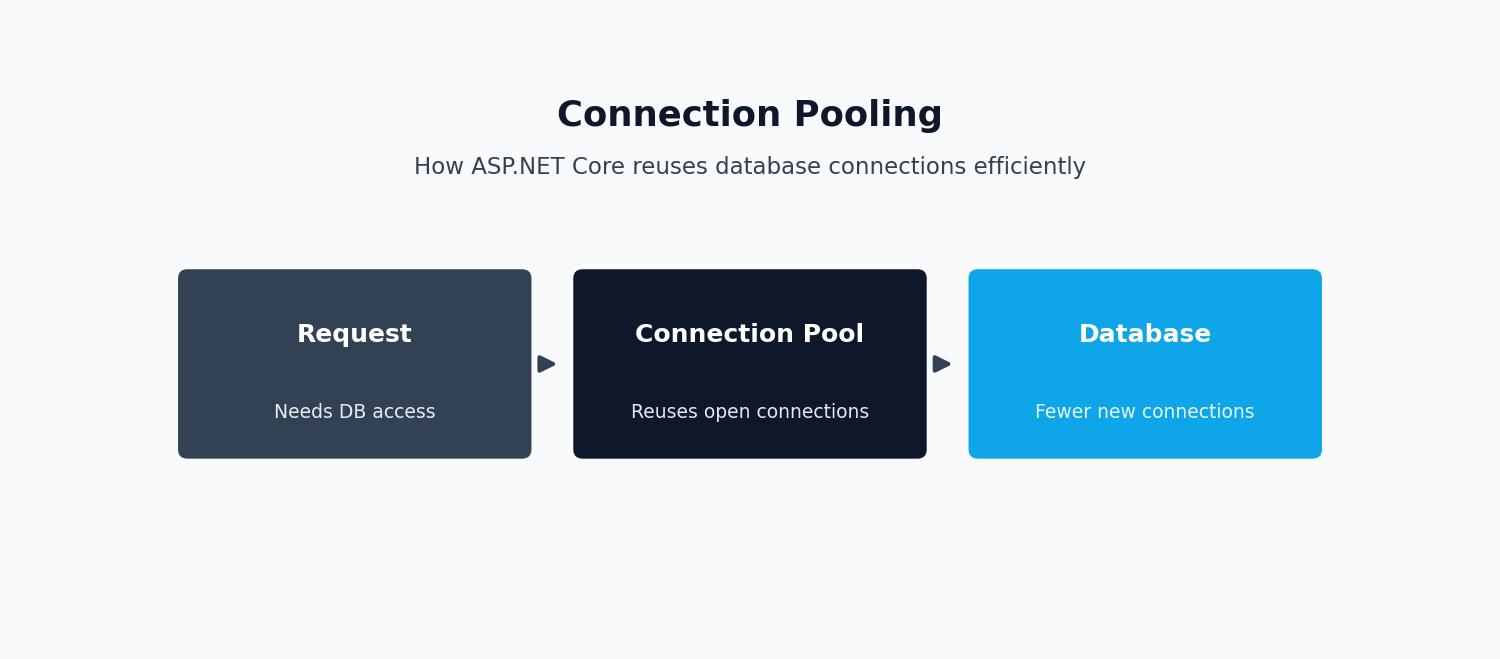
On the connection pooling side, make sure your connection string and DbContext lifetime are configured sensibly for your workload. AddDbContextPool reuses DbContext instances across requests rather than allocating a new one each time, which reduces allocation pressure under high request volume. Pair that with a database-level connection pool sized appropriately for your concurrency — too small and requests queue waiting for a connection, too large and you risk overwhelming the database server itself, especially under bursty traffic.
Response Compression
For APIs returning JSON payloads of any meaningful size, enabling response compression reduces the bytes sent over the wire, which matters both for client-perceived latency and for outbound bandwidth costs at scale. ASP.NET Core’s response compression middleware supports both Gzip and Brotli, and Brotli generally produces smaller payloads at a comparable or better compression speed for typical JSON content.
builder.Services.AddResponseCompression(options =>
{
    options.EnableForHttps = true;
    options.Providers.Add<BrotliCompressionProvider>();
    options.Providers.Add<GzipCompressionProvider>();
});

builder.Services.Configure<BrotliCompressionProviderOptions>(options =>
{
    options.Level = System.IO.Compression.CompressionLevel.Fastest;
});
The compression level matters: the higher compression levels squeeze out more bytes but cost more CPU per request, which can become a bottleneck of its own under high concurrency. For most high-traffic APIs, a faster compression level is the right tradeoff, since the CPU saved by not maximally compressing every response usually outweighs the extra few hundred bytes on the wire. If you are already terminating TLS and compressing at a reverse proxy or CDN layer, double check you are not compressing twice — doing the same work in both the application and the proxy is wasted CPU on both ends.
Efficient JSON Serialization
Serialization happens on essentially every request an API handles, which makes it a disproportionately important target for tuning. System.Text.Json, the default serializer in ASP.NET Core, is fast out of the box, but its default configuration is not always tuned for a specific application’s payload shapes, and a few adjustments can reduce both CPU time and allocations at scale.
builder.Services.Configure<Microsoft.AspNetCore.Http.Json.JsonOptions>(options =>
{
    options.SerializerOptions.DefaultIgnoreCondition =
        System.Text.Json.Serialization.JsonIgnoreCondition.WhenWritingNull;
    options.SerializerOptions.PropertyNamingPolicy =
        System.Text.Json.JsonNamingPolicy.CamelCase;
    options.SerializerOptions.NumberHandling =
        System.Text.Json.Serialization.JsonNumberHandling.AllowReadingFromString;
});
Omitting null properties, as configured above, both shrinks payload size and reduces serialization work for objects with many optional fields. For very high-throughput scenarios, consider source-generated serialization via JsonSerializerContext, which produces serialization code at compile time instead of relying on runtime reflection — this cuts startup cost and steady-state CPU usage for serialization-heavy workloads. It is also worth auditing your DTOs directly rather than serializing full EF Core entities: entities often carry navigation properties and extra fields that bloat the payload and can accidentally trigger lazy-load queries mid-serialization if change tracking and lazy loading are both enabled, which is a subtle and hard-to-diagnose source of both N+1 queries and inflated response sizes.
Middleware Pipeline Ordering and Its Performance Impact
Every request in ASP.NET Core passes through the middleware pipeline in the order it was registered, and that ordering has real performance consequences, not just correctness implications. Middleware registered early in the pipeline runs on every single request, including ones that will ultimately be rejected or short-circuited further down, so expensive middleware placed too early wastes work on requests that never needed it.
A practical example: authentication and authorization middleware should generally run before expensive business-logic middleware, so that unauthenticated requests are rejected cheaply and early rather than after doing meaningful work. Response compression and output caching middleware placement also matters — output caching should typically sit early enough to short-circuit the pipeline entirely on a cache hit, avoiding the cost of running authorization, model binding, and controller logic for a response you already have cached.
Conversely, middleware that inspects or modifies the response body, like compression, needs to run after the components that generate that body. Getting this ordering wrong does not usually break functionality, which is exactly why it is easy to miss — it just quietly adds latency and CPU cost to every request that a slightly different ordering would have avoided.
Health Checks and Load Balancer Considerations
In a horizontally scaled deployment, your load balancer or orchestrator relies on health check endpoints to decide whether an instance should keep receiving traffic. ASP.NET Core’s health checks middleware makes this straightforward to wire up, but it is worth being deliberate about what a health check actually verifies and how expensive it is to run.
builder.Services.AddHealthChecks()
    .AddDbContextCheck<AppDbContext>("database")
    .AddCheck<DependencyHealthCheck>("downstream-api");

app.MapHealthChecks("/health/live", new HealthCheckOptions
{
    Predicate = check => check.Tags.Contains("live")
});

app.MapHealthChecks("/health/ready", new HealthCheckOptions
{
    Predicate = _ => true
});
Separating liveness from readiness checks, as shown above, matters at scale: a liveness check should be extremely cheap and simply confirm the process is running and responsive, since it may be polled every few seconds by an orchestrator deciding whether to restart the instance. A readiness check can afford to verify downstream dependencies like the database or a critical external API, but if that check itself is slow or resource-intensive, it can become a load source in its own right when polled frequently across many instances. Also make sure health check endpoints are excluded from your normal authentication and rate-limiting middleware where appropriate, since a load balancer hitting a protected health endpoint that suddenly starts failing auth checks can trigger a cascading false-positive outage.
Horizontal Scaling and Stateless Design
No amount of in-process tuning replaces the ability to add more instances when traffic grows, but horizontal scaling only works cleanly if your application is actually stateless. Session state, in-memory caches that are not synchronized across instances, and singleton services holding request-specific mutable state all break the assumption that any instance can handle any request. Before scaling out, audit for these patterns: session data should live in a distributed store like Redis rather than in-process memory, caching that needs to be consistent across instances should use a distributed cache or a tag-based invalidation strategy propagated across nodes, and background work that must run exactly once should use a distributed lock or a dedicated worker rather than relying on in-process timers that would fire redundantly on every instance.
Statelessness also simplifies deployment patterns like rolling updates and blue-green deployments, since instances can be added, removed, or replaced without coordinating in-memory state between them. For APIs under genuinely high and growing traffic, designing for statelessness from the start is usually cheaper than retrofitting it later, because state tends to accumulate in convenient but hidden places — a static dictionary used as an ad hoc cache, a singleton service that was supposed to be scoped — that only surface as bugs once you actually run multiple instances behind a load balancer.
Profiling and Diagnostics: Finding Bottlenecks Instead of Guessing
Every technique described above is only useful when applied to an actual measured bottleneck. Guessing at performance problems and applying fixes speculatively is a common way to add complexity without improving anything, and it can even make things worse by obscuring the real issue. Effective ASP.NET Core Performance Tuning starts with data, not intuition.
dotnet-trace is the first tool worth reaching for when you need to understand what a running ASP.NET Core process is actually doing under load. It captures a low-overhead event trace that you can analyze in a tool like PerfView or Visual Studio’s profiler, and it is particularly good at surfacing thread pool starvation, garbage collection pressure, and time spent in specific method calls without requiring code changes or a debugger attached. For production environments, dotnet-trace collect against a running process gives you a real snapshot of behavior under actual traffic, which is far more informative than anything you can reproduce locally with synthetic load.
Application Insights, or an equivalent APM tool, fills a different and complementary role: continuous, low-overhead monitoring across the full request lifecycle, including dependency calls to your database and downstream services. Distributed tracing through Application Insights lets you see exactly where time is spent within a single request — how much was the database call, how much was serialization, how much was a downstream HTTP call — which is invaluable for prioritizing tuning work. Without this visibility, it is easy to spend days optimizing serialization when the actual bottleneck is an unindexed database query being called from three different endpoints.
For micro-level questions — is this specific method faster with AsNoTracking(), does this serialization configuration actually reduce allocations, is one JSON library meaningfully faster than another for your specific payload shape — BenchmarkDotNet is the right tool. It handles the notoriously tricky mechanics of accurate .NET benchmarking correctly: JIT warmup, garbage collection isolation between iterations, and statistical reporting that distinguishes a real difference from noise. Relying on manual Stopwatch timing for these kinds of questions routinely produces misleading results, because a single run is dominated by JIT compilation and cold caches rather than steady-state performance.
The Microsoft documentation on ASP.NET Core performance best practices is a good reference to keep close at hand, as is the guidance on Entity Framework Core performance, since both are updated as the frameworks evolve and cover edge cases beyond what fits in a single post.
Bringing ASP.NET Core Performance Tuning Together
None of these techniques exist in isolation, and applying all of them at once to a codebase that has not been profiled is not a good strategy. The right approach to ASP.NET Core Performance Tuning is iterative: measure with real diagnostic tools under representative load, identify the actual bottleneck — which is disproportionately likely to be database access or a sync-over-async pattern rather than JSON serialization or middleware ordering — fix that specific thing, and measure again. Caching, compression, and minimal API adoption are real levers, but they are most valuable once the fundamentals of async correctness and efficient data access are already in place; layering caching on top of an N+1 query problem just means you are caching a slow response instead of fixing it.
If your team is under pressure to scale an existing API and does not have deep in-house experience with these patterns, it is often faster and less risky to bring in outside help for a focused ASP.NET Core Performance Tuning engagement rather than learning through production incidents. An experienced ASP.NET Core developer who has done this work before can usually identify the highest-impact fixes within days by profiling the actual application rather than applying generic advice, which tends to be far more cost-effective than an open-ended internal effort. Whether you handle it internally or bring in specialized help, treating performance as a measured, iterative discipline rather than a one-time cleanup is what separates APIs that degrade gracefully under growth from ones that fall over the first time real traffic arrives.
Frequently Asked Questions
What’s the single biggest performance mistake in ASP.NET Core APIs?
Blocking async calls, typically by calling .Result or .Wait() on a Task, or mixing sync and async code paths in the same request. This ties up thread pool threads under load and causes latency to spike non-linearly once concurrency climbs, even though the same code looks fine in staging with low traffic.
Should I use Minimal APIs or Controllers for a high-traffic endpoint?
Minimal APIs have lower per-request overhead because they skip some of the MVC pipeline machinery, which matters at very high request volumes. For most teams the difference is marginal compared to fixing async correctness, caching, and database access first, so it shouldn’t be the first optimization you reach for.
Does response caching actually help if my data changes frequently?
Yes, if you scope it correctly. Short-lived output caching (seconds, not minutes) on read-heavy endpoints can absorb large traffic spikes without serving meaningfully stale data. The key is choosing cache duration and vary-by keys based on how fast the underlying data actually changes, not applying one blanket policy everywhere.
How much does connection pooling and query tuning matter compared to code-level fixes?
Often more. Untracked entity graphs, N+1 queries, and exhausted connection pools are frequently the actual root cause behind APIs that “fall over” under load, even when the application code itself looks correct. Profiling database access is usually where the biggest wins are found.
What tools should I use to find the actual bottleneck instead of guessing?
dotnet-trace and dotnet-counters for CPU and runtime diagnostics, combined with request-level tracing to see where time is actually spent across middleware, database calls, and serialization. Guessing at optimizations without profiling first usually means fixing something that wasn’t the bottleneck.
Does middleware ordering really affect performance?
Yes. Middleware that does expensive work (authentication, logging, compression) runs on every request in the order it’s registered, so placing heavy middleware before cheap early-exit checks (like health check endpoints) adds unnecessary overhead to requests that don’t need it.
Need this built or reviewed in production? Hire a senior full-stack developer or explore my AI integration services.
